The orchestrated disinformation campaign by RealClimate.org to falsely discredit and censor our work
- CERES team

- Sep 18, 2023
- 37 min read
In July and August 2023, several of us at CERES-Science were involved in three important new peer-reviewed scientific papers. So far, most of the feedback from the scientific community and the public on these papers has been very positive.
However, a small number of activist scientists have been aggressively conducting an orchestrated disinformation campaign to discredit the papers and the scientific reputation of the authors. This disinformation campaign appears to be spearheaded by the RealClimate.org team.
Last week, we debunked their main claims in a Sep 8th, 2023 blog post. However, despite this, they have doubled-down and are continuing their disinformation campaign with multiple false and misleading claims about these papers and the authors.
We have trawled through all of their disinformation and compiled a list of all their false and misleading claims. In this new post, we will go through each of them and fact-check them.
The claims are as follows:
Claim 1: The MDPI scientific publishing group is unscientific (False)
Claim 2: The 37 co-authors of S2023 are “climate deniers” (False and ad hominem)
Claim 3: Our rural-only record is cherry-picked and poorly sampled (Misleading)
Claim 4: Our rural-only record is inconsistent with other non-urban temperature records (False)
Claim 5: The Hoyt and Schatten (1993) TSI record has been debunked (False)
Claim 6: The Hoyt and Schatten (1993) TSI record was based on Baliunas & Jastrow (1990) (False)
Claim 7: The scientific debates over the best satellite TSI composite are irrelevant for evaluating TSI changes since the 19th century (False)
Claim 8: The Hoyt and Schatten (1993) TSI reconstruction is the only one of the 27 that finds a large solar role (False)
Claim 9: Soon (2005) made a “failed prediction” about Arctic temperatures (Misleading)
Claim 10: Dr. Soon is in the pay of Big Oil and all his work is corrupted by fossil fuel money (False and ad hominem)
Claim 11: Dr. Soon’s science is based on faulty assumptions and bad science (False and ad hominem)
Claim 12: The 37 co-authors of S2023’s scientific reputations are very poor (False and ad hominem)
Claim 13: Dr. Soon assumes that the Sun must be the dominant climate driver and is blinded by confirmation bias (False)
Before we get to the detailed fact-checks on each of these claims, it is important to have a reasonable understanding of the background to our research, its significance and the past behavior of the RealClimate.org group.
Background to our research
Recently, several of us at CERES-Science co-authored three important new peer-reviewed scientific papers:
“K2023”: G. Katata, R. Connolly and P. O’Neill (2023). "Evidence of urban blending in homogenized temperature records in Japan and in the United States: implications for the reliability of global land surface air temperature data". Journal of Applied Meteorology and Climatology. 62(8), 1095-1114. https://doi.org/10.1175/JAMC-D-22-0122.1. (Open access)
“C2023”: R. Connolly, W. Soon, M. Connolly, S. Baliunas, J. Berglund, C.J. Butler, R.G. Cionco, A.G. Elias, V. Fedorov, H. Harde, G.W. Henry, D.V. Hoyt, O. Humlum, D.R. Legates, N. Scafetta, J.-E. Solheim, L. Szarka, V.M. Velasco Herrera, H. Yan and W.J. Zhang (2023). "Challenges in the detection and attribution of Northern Hemisphere surface temperature trends since 1850". Research in Astronomy and Astrophysics. https://doi.org/10.1088/1674-4527/acf18e. (Still in press, but pre-print available here)
“S2023”: W. Soon, R. Connolly, M. Connolly, S.-I. Akasofu, S. Baliunas, J. Berglund, A. Bianchini, W.M. Briggs, C.J. Butler, R.G. Cionco, M. Crok, A.G. Elias, V.M. Fedorov, F. Gervais, H. Harde, G.W. Henry, D.V. Hoyt, O. Humlum, D.R. Legates, A.R. Lupo, S. Maruyama, P. Moore, M. Ogurtsov, C. ÓhAiseadha, M.J. Oliveira, S.-S. Park, S. Qiu, G. Quinn, N. Scafetta, J.-E. Solheim, J. Steele, L. Szarka, H.L. Tanaka, M.K. Taylor, F. Vahrenholt, V.M. Velasco Herrera and W. Zhang (2023). "The Detection and Attribution of Northern Hemisphere Land Surface Warming (1850–2018) in Terms of Human and Natural Factors: Challenges of Inadequate Data", Climate, 11(9), 179; https://doi.org/10.3390/cli11090179. (Open access)
These papers provide substantial scientific advances in the very challenging and complex scientific problem that is referred to technically as the “detection and attribution of climate change” since the mid-19th century.
Essentially, “the detection and attribution of climate change” problem involves trying to answer two different, but related questions:
Detection of climate change: How has climate changed since the mid-19th century?
Attribution of climate change: What factors are responsible for those climate changes and are they mostly human-caused (“anthropogenic”), mostly natural, or some mixture of both?
The UN’s Intergovernmental Panel on Climate Change (IPCC) claim to have confidently resolved the answers to both questions in their highly influential Assessment Reports (AR for short).
In their most recent 6th Assessment Report (AR6, 2021), they concluded with remarkable confidence that:
Global surface temperatures have risen about 1°C (nearly 2°F) since the mid-19th century, and that this rate of global warming is “unprecedented in more than 2000 years”.
Human drivers (chiefly greenhouse gas emissions) are responsible for all (or most) of that global warming.
These IPCC findings have been widely reported around the world, e.g., The New York Times, Aug 9th, 2021; Science, Aug 9th, 2021; Reuters, Aug 9th, 2021; BBC News, Aug 9th, 2021; The Economist, Aug 9th, 2021; The Guardian, Aug 9th, 2021.
However, our latest papers collectively show that the IPCC had failed to satisfactorily address several critical scientific problems when they carried out their detection and attribution analysis. As a result, those widely-reported confident conclusions were scientifically premature.
For a quick summary of what we found, see our Sep 1st, 2023 press release. For a more detailed summary see our blog post from last week (Sep 8th, 2023).
Essentially, we have shown that:
The IPCC substantially underestimated the extent to which the land component of their global surface temperature data was contaminated by “urbanization bias”. Urbanization biases are localized warming effects affecting thermometer stations located in urban areas. Urban areas only account for 3-4% of the land surface and only about 2% of the planet’s surface, but urbanized stations represent the majority of the thermometer records (more than 75% of all stations and more than 85% of the longest thermometer records).
The temperature data from outside of urban areas from multiple sources – long rural station records, ocean temperature records, tree ring temperature proxies and glacier length temperature proxies – show a more nuanced history of temperature changes since the mid-19th century. This non-urban data suggests temperatures have alternated between multi-decadal periods of warming and then of cooling and then warming. In contrast, the urban data suggests an almost continuous warming since the 19th century.
The IPCC’s chosen estimates of the changes in solar activity (“total solar irradiance” or TSI for short) only represented a small subset of those used by the scientific community. Several of the TSI estimates the IPCC had neglected in their analysis suggest that most of the warming since the 19th century could be natural – especially from the non-urbanized data. Others suggest that the warming has been a mixture of natural and human-caused factors. Others agree with the IPCC’s attribution statements.
Given these uncertainties, we have concluded that the scientific community is not yet in a position to say whether the global temperature changes since the mid-19th century have been “mostly human-caused” (as IPCC AR6 claimed), “mostly natural” or some combination of factors.
So far, the feedback we have received from both the scientific community and the public on our latest work has been very encouraging and supportive.
However, a handful of activist scientists have been carrying out an orchestrated disinformation campaign to discredit and misrepresent our findings. This campaign seems to be largely organized by the RealClimate.org team.
The main public part of RealClimate.org’s current disinformation campaign was their Sep 6th 2023 post entitled “As Soon as Possible”. In that post, they made multiple intentionally false or misleading claims to try and discredit our work and discourage anybody from reading our new papers. We responded in detail to these false or misleading claims in an extensive post on Sep 8th 2023 on the CERES website. Our post was also reposted on several websites including, WattsUpWithThat.com, Climate Etc., EIKE (translated to German) and KlimaNachrichten.de.
RealClimate.org also updated their post on Sep 9th to acknowledge that we had replied to their claims. However, since then, rather than admitting their claims had been false and/or misleading, the RealClimate.org team have escalated their disinformation campaign.
In particular, they have been spreading more false and/or misleading claims about our papers on the internet (chiefly via Twitter/X.com).
All of these claims can be demonstrably shown to be false or misleading by reading the papers themselves. However, apparently, their goal is to stop people from reading the papers. They know that if people checked their claims by reading the papers, it would be quickly apparent that the RealClimate.org team is promoting disinformation.
Therefore, in this post, we have decided to go through each of the RealClimate.org team’s false or misleading claims about our latest paper. We will show that these claims are false or misleading. And, furthermore, that they have already been addressed in considerable detail in our papers.
The IPCC’s approach to the detection and attribution of climate change problem
Since their 4th Assessment Report (AR4) in 2007, the IPCC’s main basis for their attribution analysis has been through the comparison of computer model “hindcasts” to global surface temperature records.
A computer model “hindcast” is the opposite of a “forecast”. Forecasts try to predict what will happen in the future. A hindcast tries to predict what should have happened in the past according to the computer model.
The IPCC compiles together computer model hindcasts that have been contributed by the main climate modelling groups from around the world. [Aside: Dr. Gavin Schmidt of RealClimate.org heads one of these modelling groups – the NASA GISS group.]
These hindcasts try to simulate global temperature changes since the late-19th century in terms of different combinations of natural and human-caused factors:
“Only natural factors” hindcasts. These are hindcasts where the only climate drivers considered are changes in solar activity (in terms of TSI) and stratosphere-reaching volcanic eruptions. According to the models, “solar” can cause either warming orcooling, but “volcanic” can only cause temporary cooling events (lasting 2-3 years).
“Only anthropogenic factors” hindcasts. These are hindcasts that only include human-caused climate drivers. The main anthropogenic factors considered by the models are: (a) greenhouse gases (of which CO2 is considered the most important) that are believed to only have a warming effect and (b) human-caused “aerosols” (air pollution from small sulphate particles) that are believed to only have a cooling effect.
“Natural and anthropogenic factors” hindcasts. These are hindcasts that include all of the above factors.
They then compare these hindcasts to their “observed” global temperature records.
According to the 4th Assessment Report (AR4, 2007), the 5th Assessment Report (AR5, 2013) and the latest 6th Assessment Report (AR6, 2021):
The “only natural factors” hindcasts were unable to explain any of the observed warming after the mid-20th century.
The “only anthropogenic factors” hindcasts could explain the long-term warming, but missed some of the subtle short-term climate changes.
The “natural and anthropogenic factors” hindcasts gave the best matches to the observed global temperature record.
On this basis, all three IPCC reports have consistently concluded that since at least the mid-20th century, the observed global temperature changes have been mostly anthropogenic.
Or to put it simply: the IPCC says that global warming is mostly human-caused.
Our approach to the detection and attribution of climate change problem
After IPCC AR5 was published, we were alarmed to discover that the detection and attribution analysis the IPCC was using was failing to properly address at least two critical scientific problems:
How much has urbanization bias contaminated the land component of the temperature data used for the “detection” part?
How has solar activity (TSI) changed since the 19th century (and earlier)?
The CERES-Science team have so far co-authored a total of 10 scientific peer-reviewed papers trying to scientifically resolve these two key challenges related to the detection and attribution of climate change:
“S2015”: Soon, Connolly & Connolly (2015). Earth-Science Reviews, 150, 409-452. https://doi.org/10.1016/j.earscirev.2015.08.010. (Preprint version)
“C2017”: Connolly, Connolly & Soon (2017). Hydrological Sciences Journal, 62, 1317-1340. https://doi.org/10.1080/02626667.2017.1324974. (Open access)
“S2018”: Soon and 7 co-authors (2018). Earth-Science Reviews, 185, 80-101. https://doi.org/10.1016/j.earscirev.2018.05.013. (Preprint version)
“S2019”: Soon and 7 co-authors (2019). Earth-Science Reviews, 189, 102950. https://doi.org/10.1016/j.earscirev.2019.102950. (Preprint version)
“C2020”: Connolly and 3 co-authors (2020). Energies, 13, 1365. https://doi.org/10.3390/en13061365 (Open access).
“C2021”: Connolly and 22 co-authors (2021). Research in Astronomy and Astrophysics, 21, 131. https://doi.org/10.1088/1674-4527/21/6/131. (Open access)
“O’N2022”: O'Neill and 16 co-authors (2022). Atmosphere, 13(2), 285. https://doi.org/10.3390/atmos13020285. (Open access)
“K2023”: Katata, Connolly & O’Neill (2023). Journal of Applied Meteorology and Climatology. 62(8), 1095-1114. https://doi.org/10.1175/JAMC-D-22-0122.1. (Open access)
“C2023”: Connolly and 19 co-authors (2023). Research in Astronomy and Astrophysics. https://doi.org/10.1088/1674-4527/acf18e. (Still in press, but pre-print available here)
“S2023”: Soon and 36 co-authors (2023). Climate, 11(9), 179; https://doi.org/10.3390/cli11090179. (Open access)
The first four papers were published by CERES-Science team members before CERES-Science was founded in late-2018. However, these CERES-Science papers represent a continuation of those earlier papers involving three of us (Dr. Willie Soon, Dr. Ronan Connolly and Dr. Michael Connolly).
Each of the 10 papers represents significant scientific developments on at least one aspect of the detection and attribution of climate change. Papers 1, 6, 9 and 10 are detection and attribution studies. The other papers provide important advances in resolving the problems we outlined above with current detection and attribution studies.
As you can see, while this is not the sole focus of the CERES-Science team (see our “Publications” page for our other research), it has been a scientific problem that we have been actively working on for many years now.
As we will discuss later, we are acutely aware that this is a complex scientific problem that requires expertise from many different researchers. So, many of our papers involve collaborations with many other research teams from around the world. The 10 papers described here collectively have involved 55 researchers from 27 countries.
RealClimate.org’s disinformation campaigns against our work on these scientific problems have so far only focused on two of our 10 papers: Paper 6 (C2021) and Paper 10 (S2023).
However, each of those papers was building on the findings and analysis of the preceding papers. Our approach to trying to address these scientific problems has been evolving and advancing with each paper.
Many of the false or misleading claims by RealClimate.org on Papers 6 and 10 have also been comprehensively addressed in advance multiple times in our papers (including both Papers 6 and 10). Therefore, in our direct responses to the false or misleading claims by RealClimate.org on Papers 6 and 10, we will also let you know of relevant discussions in the other 8 papers.
Who is the RealClimate.org team?
RealClimate.org was created in 2004 as a blog to promote the scientific opinions of the website owners. It is currently run by five scientists: Dr. Gavin Schmidt, Prof. Michael Mann, Dr. Rasmus Benestad, Prof. Stefan Rahmstorf and Prof. Eric Steig.
On paper, these five scientists seem like very respectable researchers that you would initially expect to be very concerned about ensuring that the scientific community and the public are being provided with all the relevant scientific opinions on climate change:
Dr. Gavin Schmidt – Director of NASA Goddard Institute for Space Studies (NASA GISS)
Prof. Michael E. Mann – Presidential Distinguished Professor of Earth & Environmental Science at the University of Pennsylvania and Director of the Penn Center for Science, Sustainability, and the Media (PCSSM)
Dr. Rasmus E. Benestad – Senior researcher at Norwegian Meteorological Institute
Prof. Stefan Rahmstorf – Co-head of Research Department on Earth System Analysis of the Potsdam Institute for Climate Impact Research (PIK) and Professor of Physics of the Oceans at University of Potsdam
Prof. Eric Steig – Professor and Chair of the Department of Earth and Space Studies in the College of the Environment at University of Washington
However, alarmingly, at least four of these scientists (Schmidt, Mann, Benestad and Rahmstorf) have been actively spreading disinformation about our recent papers on the detection and attribution of climate change. All of this disinformation can be easily seen to be demonstrably false if our papers are read. But, the goal of their disinformation campaigns seems to be to stop people from reading our papers.
Their first attempt began in late 2022 when they tried to discredit C2021 (Paper 6). Currently, they are trying to discredit S2023 (Paper 10). They seem to be making a conscious effort to not let anybody know about C2023 (Paper 9) or any of our other relevant papers.
We do not know if Prof. Steig has had any involvement in these disinformation campaigns by his RealClimate.org colleagues, but the other four have all been involved.
Richardson and Benestad (2022)’s failed attempt to discredit C2021
In October 2022, Dr. Rasmus Benestad, one of the 5 RealClimate.org members, published an article with Dr. Mark Richardson (research scientist at NASA Jet Propulsion Laboratory) in which they alleged they had proven C2021 (Paper 6) had been “erroneous”; that we had made “a basic error in the choice of statistical methods”; that our “solar conclusions should not be treated as credible and the IPCC statements on solar attribution remain intact”:
M.T. Richardson and R.E. Benestad (2022). "Erroneous use of Statistics behind Claims of a Major Solar Role in Recent Warming". Research in Astronomy and Astrophysics, 22, 125008. http://dx.doi.org/10.1088/1674-4527/ac981c. (pdf available here).
To accompany this article, on November 29th 2022, they posted on RealClimate.org a blog post called, “Serious mistakes found in recent paper by Connolly et al.”, in which they summarized their Richardson and Benestad (2022) article.
In both Richardson and Benestad (2022) and the accompanying RealClimate.org blog post, they failed to actually identify any genuine “errors” or “flaws” in C2021. Instead, their attempt to discredit C2021 involved using a series of “straw man arguments”:
“A straw man (also known as "strawman") argument is one in which the person sets up and then attacks a position that is not actually being debated. The term "straw man" refers to a straw-filled scarecrow, a literal dummy that is easily attacked and destroyed, as opposed to a logical, critically-thinking human opponent. A straw man argument is a type of red herring, an argument meant to cause confusion, one that is deliberately misleading and irrelevant to the actual issue at hand.” – Study.com
Anybody who reads both Connolly et al. (2021) and Richardson and Benestad (2022) would recognize that their alleged “rebuttal” was not genuine. Despite the hubristic language they used, Richardson and Benestad had not actually identified anything overlooked by C2021.
They were not contributing anything new to the science. Instead, apparently, their goal was to discredit C2021 and discourage people from reading it by creating the false impression that it had been “debunked”.
One of our three new papers on the detection and attribution of climate change problem, C2023 (Paper 9), is a direct response to Richardson and Benestad (2022). In C2023, we categorically show that the claims of Richardson and Benestad (2022) were baseless and untrue:
“C2023”: R. Connolly, W. Soon, M. Connolly, S. Baliunas, J. Berglund, C.J. Butler, R.G. Cionco, A.G. Elias, V. Fedorov, H. Harde, G.W. Henry, D.V. Hoyt, O. Humlum, D.R. Legates, N. Scafetta, J.-E. Solheim, L. Szarka, V.M. Velasco Herrera, H. Yan and W.J. Zhang (2023). "Challenges in the detection and attribution of Northern Hemisphere surface temperature trends since 1850". Research in Astronomy and Astrophysics. https://doi.org/10.1088/1674-4527/acf18e. (Still in press, but pre-print available here)
As far as we are aware, the RealClimate.org team have not yet updated their November 2022 post or posted another blog post to inform their readers that Richardson and Benestad (2022)’s attempted “debunk” of C2021 has itself now been debunked by C2023.
Indeed, none of the RealClimate.org team have yet commented on C2023 – despite being very much aware of it.
Dr. Benestad has apparently been quiet since his attempt was categorically refuted by C2023. In the meantime, three of the RealClimate.org team (Schmidt, Mann and Rahmstorf) have turned their attentions to trying to discredit S2023 with a new disinformation campaign – again based entirely on false and/or misleading claims that can be easily debunked by reading S2023 – or C2023!
Fact-checking RealClimate.org’s claims in their latest disinformation campaign
In their attempt to falsely discredit S2023 (Paper 10), the RealClimate.org team have apparently decided to combine the straw-manning approach of Richardson & Benestad with an additional rhetorical trick called the “Gish gallop”. According to Wikipedia, this deceptive strategy is as follows:
“During a Gish gallop, a debater confronts an opponent with a rapid series of many specious arguments, half-truths, misrepresentations, and outright lies in a short space of time, which makes it impossible for the opponent to refute all of them within the format of a formal debate. Each point raised by the Gish galloper takes considerably more time to refute or fact-check than it did to state in the first place, which is known online as Brandolini's law. The technique wastes an opponent's time and may cast doubt on the opponent's debating ability for an audience unfamiliar with the technique, especially if no independent fact-checking is involved or if the audience has limited knowledge of the topics.”
We have trawled through their multiple false or misleading claims that they have been making on the internet about S2023 in the last two weeks.
There are a lot of them!
These seem to be the main ones:
Dr. Schmidt’s Sep 6th 2023 RealClimate.org post entitled “As Soon as Possible”
Tweets/Xs by Gavin Schmidt (@ClimateOfGavin): 4:45am – 3 Sep 2023; 5:00am – 3 Sep 2023 (a); 5:00am – 3 Sep 2023 (b); 6:26pm – 9 Sep 2023; 5:56pm – 10 Sep 2023; 5:58pm – 10 Sep 2023; 8:03pm – 10 Sep 2023; 9:29pm – 10 Sep 2023.
Tweets/Xs by Prof Michael E. Mann (@MichaelEMann): 11:03pm - 5 Sep 2023; 4:07pm – 6 Sep 2023.
Tweets/Xs by Prof. Stefan Rahmstorf (@rahmstorf): 8:29 am – Sep 3 2023; 3:55 pm – Sep 4 2023.
We have compiled the above links and images of the tweets/Xs into this pdf.
We might have missed a few because they have made so many. As summarized above, Gish gallop attacks involve rapidly churning out different half-truths, misrepresentations and outright lies. However, as far as we can see, the claims we have compiled in this pdf seem to be the bulk of their claims.
Below is a detailed list of the current claims they are making about S2023 to try and stop people from reading the paper – we summarized this list at the start of this post:
Claim 1: The MDPI scientific journal publisher that owns the journal S2023 was published in runs “pay-for-play predatory journal” (Schmidt, 4:45am, Sep 3 2023); “The reputation of MDPI journals is questionable” (Rahmstorf, 8:29am, Sep 3 2023).
Claim 2: The 37 co-authors of S2023 are “climate deniers” (Mann, 5 Sep 2023)
Claim 3: Our Northern Hemisphere rural-only land surface temperature record is “unvalidated” and “a cherry-pick of Arctic stations, US and Irish stations and some very not-rural Chinese stations” (Schmidt, Sep 3 2023); it is “not a good sample of rural stations – many of which exist in the rest of Europe, Australia, Southern Africa, South America, etc.” and “not a good sample of long stations (again many of which exist elsewhere)” (Schmidt, Sep 6 2023 blog)
Claim 4: Our Northern Hemisphere rural-only land surface temperature record is “not representative of global temperatures” and “has no ocean data” (Schmidt, Sep 3 2023); it is contradicted by global temperature estimates derived from “glaciers and ice sheets” and “oceans” (Rahmstorf, Sep 3 2023 and Schmidt, Sep 6 2023 blog); it is also contradicted by ocean heat content (OHC) estimates (Mann, Sep 5 2023).
Claim 5: One of the TSI records we analysed – an updated version of Hoyt and Schatten (1993) – is “an unvalidated solar record”; “based on a bogus theory that was wrong when it was published and has not been validated in the subsequent 3 decades” (Schmidt, Sep 3 2023); was based on Sunspot Cycle Lengths (SCL) and SCL has been proven to be a poor solar activity proxy (Schmidt, Sep 6 2023 blog and Sep 10 2023 Tweets).
Claim 6: The Hoyt and Schatten (1993) TSI reconstruction was also based on Baliunas & Jastrow (1990)’s “scaling of cycling/non-cycling stars for the Maunder Minimum” and this 1990 scaling has “been found to not be valid” (Schmidt, Sep 6 2023 blog and Sep 10 2023 Tweets)
Claim 7: The ongoing scientific debate over which of the various satellite TSI composites (e.g., ACRIM vs. PMOD) are most reliable “is irrelevant to the longer term variability” of the pre-satellite era TSI estimates (Schmidt, Sep 6 2023 blog)
Claim 8: The updated Hoyt and Schatten (1993) TSI reconstruction is the only one of the 27 TSI reconstructions that we have found across the 10 papers to find a large solar contribution to the long-term warming since 1850 (Schmidt, Sep 10 2023)
Claim 9: A 2005 study by Dr. Soon made a “failed prediction” about Arctic temperature trends for the 21st century (Schmidt, Sep 6 2023 blog and Sep 9 2023 Tweets)
Claim 10: “Willie Soon gets money from fossil fuel companies” (Schmidt, Sep 10 2023) and his scientific research is corrupted by funding from vested interests (Rahmstorf, Sep 4 2023).
Claim 11: Dr. Soon’s “science is based on faulty assumptions” (Schmidt, Sep 10 2023) and he has “lost any last shred of credibility he might once have had” (Mann, Sep 6 2023).
Claim 12: All 37 co-authors of S2023 have highly “questionable” reputations (Rahmstorf, Sep 3 2023)
Claim 13: Dr. Soon assumes “that the sun *must* be the dominant impact on the climate and so it’s just required to find the proof. That leads to multiple cases of confirmation bias and spurious correlation. This turns normal science on its head.” (Schmidt, Sep 10 2023)
Let us now fact-check each of these claims in turn.
Claim 1: The MDPI scientific publishing group is unscientific (False)
Claim 1: The MDPI scientific journal publisher that owns the journal S2023 was published in runs “pay-for-play predatory journal” (Schmidt, 4:45am, Sep 3 2023); “The reputation of MDPI journals is questionable” (Rahmstorf, 8:29am, Sep 3 2023).
Many readers who are not familiar with the current scientific publishing landscape probably are unfamiliar with the origin of these opinionated claims about the MDPI scientific publishing group.
Until recently, the scientific publishing landscape was dominated by five main publishing groups (Elsevier, Springer, Taylor & Francis, Wiley and SAGE). These are still known as “The Big 5” among the scientific community.
However, over the last two decades, many scientists and academics have become concerned that their publications are “paywalled” and can only be accessed by other researchers based in an academic institution with a library subscription. This has led to the “open access” movement.
MDPI is one of the leaders in this new open access approach to scientific publishing. Many researchers who want their scientific results to be widely-read have chosen to publish their articles in open access journals. As a result, MDPI and other open access journals have rapidly become major players in the scientific publishing business.
As can be seen below, in 2022, MDPI was the largest publisher of open access scientific articles and the third largest scientific publisher of all scientific articles (when we count both paywalled and open access articles). Source: Wordsrated.com


So, the claims of Schmidt and Rahmstorf that the MDPI publishing group is not reputable are out-dated and poorly-researched smears.
At any rate, while 3 of our 10 papers on the detection and attribution of climate change problems are in MDPI journals, the other 7 are not. Below are the publishers for each of the 10 papers:
S2015: Elsevier (Earth-Science Reviews)
C2017: Taylor & Francis (Hydrological Sciences Journal)
S2018: Elsevier (Earth-Science Reviews)
S2019: Elsevier (Earth-Science Reviews)
C2020: MDPI (Energies)
C2021: Institute of Physics, IOP (Research in Astronomy and Astrophysics)
O’N2022: MDPI (Atmosphere)
K2023: American Meteorological Society, AMS (Journal of Applied Meteorology and Climatology)
C2023: Institute of Physics, IOP (Research in Astronomy and Astrophysics)
S2023: MDPI (Climate)
Claim 2: The 37 co-authors of S2023 are “climate deniers” (False and ad hominem)
Claim 2: The 37 co-authors of S2023 are “climate deniers” (Mann, 5 Sep 2023)
This is absurd.
The title of S2023 was “The Detection and Attribution of Northern Hemisphere Land Surface Warming (1850–2018) in Terms of Human and Natural Factors: Challenges of Inadequate Data”. The goal was the detection and attribution of climate change since 1850 on the Northern Hemisphere.
If we were “denying climate” or even “denying climate change”, why would we have bothered carried out an extensive “detection and attribution of climate change” study.
This was a particularly bizarre and illogical claim by Prof. Mann.
Claim 3: Our rural-only record is cherry-picked and poorly sampled (Misleading)
Claim 3: Our Northern Hemisphere rural-only land surface temperature record is “unvalidated” and “a cherry-pick of Arctic stations, US and Irish stations and some very not-rural Chinese stations” (Schmidt, Sep 3 2023); it is “not a good sample of rural stations – many of which exist in the rest of Europe, Australia, Southern Africa, South America, etc.” and “not a good sample of long stations (again many of which exist elsewhere)” (Schmidt, Sep 6 2023 blog)
As we discussed in last week’s reply (Sep 8th, 2023) to RealClimate.org’s post, trying to determine the long-term temperature trends since the mid-19th century using only rural stations is very challenging. The key problems are summarized below:

As our first attempt at this problem, we confined our analysis to the four geographical regions that had most of the longest and most complete rural station records – all four of these regions were located in the Northern Hemisphere – but geographically isolated from each other and covering the main climatic zones from the tropics to the mid-latitudes to the polar region.
Although these four regions do exclude some of the shorter rural station records (as Dr. Schmidt pointed out) and some of the longest urban station records (as Dr. Schmidt also pointed out), these regions accounted for more than 80% of the rural data for the early 20th century from either hemisphere.
While the other groups have (prematurely) assumed that the automated “temperature homogenization” computer programs most groups use are improving the reliability of the data by accurately removing non-climatic biases from the temperature records, we realised that this optimistic assumption is wrong and seriously flawed.
We have been warning the homogenization community that the standard temperature homogenization algorithms have major statistical problems and that they are themselves inadvertently introducing new non-climatic biases into many of the temperature records. In particular:
One of the most-widely used homogenization algorithms, NOAA’s “Pairwise Homogenization Algorithm (PHA)” – developed by Menne and Williams (2009) – is remarkably inconsistent in the temperature adjustments it applies to each temperature record. We find that the “homogenization adjustments” NOAA would apply to a given temperature record can change dramatically from week to week! We have documented how serious a problem this is in Paper 7 (O’N2022).
A statistical artefact of the current homogenization algorithms is a problem we call “urban blending”. When urban neighbors are used to correct for non-climatic biases in a rural station, some of the urban warming of the neighbors gets “aliased” into the homogenized rural record – and vice versa. As a result, after homogenization, all station records show similar trends (the records are all “homogeneous”). But, the homogenized “rural” records are no longer free from urban warming. We have shown this on theoretical and experimental grounds in Papers 3 and 4 (S2018 and S2019) and have recently confirmed in Paper 8 (K2023) that this is a serious and widespread problem that has been overlooked by the temperature homogenization community. Fortunately, some other groups have recently begun taking this urban blending problem seriously, e.g., the recent study by He and colleagues (2023), "Updated analysis of surface warming trends in North China based on in-depth homogenized data (1951-2020)", Climate Research, 91:47-66. https://doi.org/10.3354/cr01724 (Open access)
Since S2015 (Paper 1), we have recognized that blindly relying on the automated temperature homogenization computer programs was scientifically inappropriate. But, we also recognized that we needed to account for the other non-climatic biases associated with all temperature records. Therefore, we have so far confined our analysis to regions where we have station history metadata or other climatic information to try and correct for known non-climatic biases.
This is an ongoing project. We are continuing our efforts into developing a more comprehensive rural-only temperature record, but most of the other groups producing global temperature records (including Dr. Schmidt’s NASA GISS) seem blissfully unaware of how complex and challenging this problem is.
For more details on how we are continuing our efforts on constructing the most comprehensive and complete rural-only global temperature record from the mid-19th century to present, see C2017 (Paper 2); S2018 (Paper 3); S2019 (Paper 4); C2021 (Paper 6); O’N2022 (Paper 7); K2023 (Paper 8); C2023 (Paper 9) and S2023 (Paper 10).
In the meantime, in each of our papers using Northern Hemisphere rural-only series, we have considered in detail how climatically representative the series is of global temperatures (or at least Northern Hemisphere temperature). In S2015 (Paper 1) and S2023 (Paper 10), we discuss how the rural-only records are very consistent with independent temperature estimates based on (a) sea surface temperatures, (b) tree-ring temperature proxies and (c) glacier-length temperature proxies.
In C2021 (Paper 6) and C2023 (Paper 9), we consider five different temperature estimates for the Northern Hemisphere:
Our rural-only series
The standard urban and rural series
Sea surface temperatures
Tree-ring temperature proxies
Glacier-length temperature proxies.
Our overall findings in C2021 and C2023 (where we considered all five estimates) are broadly consistent with S2023 (where we focused on just the two weather-station based land temperature estimates).
Claim 4: Our rural-only record is inconsistent with other non-urban temperature records (False)
Claim 4: Our Northern Hemisphere rural-only land surface temperature record is “not representative of global temperatures” and “has no ocean data” (Schmidt, Sep 3 2023); it is contradicted by global temperature estimates derived from “glaciers and ice sheets” and “oceans” (Rahmstorf, Sep 3 2023 and Schmidt, Sep 6 2023 blog); it is also contradicted by ocean heat content (OHC) estimates (Mann, Sep 5 2023).
These claims have been already addressed in detail in our papers:
pp. 435-441 of S2015: Soon, Connolly & Connolly (2015). Earth-Science Reviews, 150, 409-452. https://doi.org/10.1016/j.earscirev.2015.08.010. (Preprint version)
pp. 35-44 of C2021: Connolly and 22 co-authors (2021). Research in Astronomy and Astrophysics, 21, 131. https://doi.org/10.1088/1674-4527/21/6/131. (Open access)
All of C2023: Connolly and 19 co-authors (2023). Research in Astronomy and Astrophysics. https://doi.org/10.1088/1674-4527/acf18e. (Still in press, but pre-print available here)
pp. 6-12 of S2023: Soon and 36 co-authors (2023). Climate, 11(9), 179; https://doi.org/10.3390/cli11090179. (Open access)
Below we compare our rural-only Northern Hemisphere land surface temperature reconstruction to other Northern Hemisphere temperature estimates based on:
(a) sea surface temperatures (as suggested by Dr. Schmidt and Prof. Rahmstorf);
(b) tree-ring proxies;
(c) glacier-length proxies (as suggested by Prof. Rahmstorf);
(d) weather balloons;
(e) satellite measurements.
We also compared it to two other climate change indicators:
(f) ocean heat content (as suggested by Prof. Mann);
(g) world-wide precipitation.
Despite RealClimate.org’s claims, all of these climate change indicators seem to be quite consistent with our rural-only record – with the exception of world-wide precipitation (which does not seem to have had a noticeable trend since the start of the record)

Claim 5: The Hoyt and Schatten (1993) TSI record has been debunked (False)
Claim 5: One of the TSI records we analysed – an updated version of Hoyt and Schatten (1993) – is “an unvalidated solar record”; “based on a bogus theory that was wrong when it was published and has not been validated in the subsequent 3 decades” (Schmidt, Sep 3 2023); was based on Sunspot Cycle Lengths (SCL) and SCL has been proven to be a poor solar activity proxy (Schmidt, Sep 6 2023 blog and Sep 10 2023 Tweets).
Hoyt and Schatten (1993) was one of the 6 TSI series considered by the CMIP3 modelling project that the IPCC used for their detection and attribution analysis in their 4th Assessment Report (AR4, 2007). It was also one of the two main TSI series discussed in the IPCC’s 3rd Assessment Report (AR3, 2001).
D.V. Hoyt and K.H. Schatten (1993). "A discussion of plausible solar irradiance variations, 1700-1992". Journal of Geophysical Research Space Physics, 98(A11), 18895-18906. https://doi.org/10.1029/93JA01944. (pdf available here)
However, apparently partly as a result of Dr. Schmidt’s involvement in the TSI choices for AR5, Hoyt and Schatten (1993) was quietly dropped from the attribution studies in AR5 or AR6.
From Dr. Schmidt’s confused statements about how he thinks Hoyt and Schatten (1993) was compiled, we now wonder if he has even read Hoyt and Schatten (1993).
But, even if he hasn’t read Hoyt and Schatten (1993), we have explicitly discussed how it was compiled in several of our papers:
pp. 422-423 of S2015: Soon, Connolly & Connolly (2015). Earth-Science Reviews, 150, 409-452. https://doi.org/10.1016/j.earscirev.2015.08.010. (Preprint version)
pp. 10-12 of C2021: Connolly and 22 co-authors (2021). Research in Astronomy and Astrophysics, 21, 131. https://doi.org/10.1088/1674-4527/21/6/131. (Open access)
pp. 4,6, 12-13, 25-26 of S2023: Soon and 36 co-authors (2023). Climate, 11(9), 179; https://doi.org/10.3390/cli11090179. (Open access)
For what it’s worth, Douglas V. Hoyt was a co-author of C2021 (Paper 6), C2023 (Paper 9) and S2023 (Paper 10).
The false notion that Hoyt and Schatten (1993)’s TSI composite was based on "solar cycle lengths" seems to have originated in an erroneous description by Lean et al. (1995).
J. Lean, J. Beer, R. Bradley (1995). "Reconstruction of solar irradiance since 1610: Implications for climate change". Geophysical Research Letters, 22 (23), 3195-3198. https://doi.org/10.1029/95GL03093 (paywalled, but pdf here)
Recently, Chatzistergos (2023) has reawakened this erroneous claim:
T. Chatzistergos (2023). “Is there a link between the length of the solar cycle and Earth’s temperature?”. Rendiconti Lincei. Scienze Fisiche e Naturali. 34, 11–21. https://doi.org/10.1007/s12210-022-01127-z (Open access)
However, Hoyt & Schatten (1993) was quite explicit that their TSI reconstruction was based on 5 solar activity proxies for the pre-satellite era and the NIMBUS-7 satellite for calibration and the satellite era.
Hoyt & Schatten (1993)'s 5 solar proxies in their TSI reconstruction are:
Mean sunspot number
Decay rate of the solar cycle
The fraction of penumbral spots
Solar equatorial rotation rate
Solar cycle length
As an aside, most of the current TSI reconstructions – except for Dewitte et al. (2022)'s rescaled Sunspot Number (SSN) reconstruction and a similar proposed but not peer-reviewed reconstruction in 2014 by Dr. Svalgaard – also use multiple solar proxies - each trying to capture different aspects of solar variability. But, so far Hoyt and Schatten (1993) seems to have been the TSI reconstruction that has incorporated the most number of different solar proxies.
Hoyt and Schatten (1993) included Solar Cycle Length (SCL) as one of its five proxies, but only one.
Dr. Schmidt points to two articles by Prof. Peter Laut criticizing a completely different Sun/climate study that used a statistically-filtered SCL time series as a proxy of solar activity, i.e., Friis-Christensen & Lassen (1991):
E. Friis-Christensen & K. Lassen (1991). “Length of the Solar Cycle: An Indicator of Solar Activity Closely Associated with Climate”. Science, 254 (5032), 698-700. https://doi.org/10.1126/science.254.5032.698 (Paywalled, but pdf available here)
P. Laut and J. Gundermann (2000). "Solar cycle lengths and climate: A reference revisited", Journal of Geophysical Research: Space Physics, 105, 27489-27492. http://dx.doi.org/10.1029/2000JA900068 (Open access)
P. Laut (2003). "Solar activity and terrestrial climate: an analysis of some purported correlations", Journal of Atmospheric and Solar-Terrestrial Physics, 65, 801-812. http://dx.doi.org/10.1016/S1364-6826(03)00041-5 (Paywalled, but pdf available here)
Laut and Gundermann (2000) and Laut (2003) were not criticising the use of SCL as a solar proxy of some aspect of solar activity. Instead, they were arguing that Friis-Christensen & Lassen (1991)'s claim that Northern Hemisphere temperatures were well correlated to a statistically filtered version of the SCL data up until the 1980s broke down with more recent data and the use of more objective statistical filtering than the 1940s filtering Friis-Christensen & Lassen had repeated.
So, the claim by Dr. Schmidt that Hoyt & Schatten (1993)'s TSI reconstruction was somehow "debunked" by Laut (2003) is completely wrong.
Claim 6: The Hoyt and Schatten (1993) TSI record was based on Baliunas & Jastrow (1990) (False)
Claim 6: The Hoyt and Schatten (1993) TSI reconstruction was also based on Baliunas & Jastrow (1990)’s “scaling of cycling/non-cycling stars for the Maunder Minimum” and that this 1990 scaling has “been found to not be valid” (Schmidt, Sep 6 2023 blog and Sep 10 2023 Tweets)
This claim is also false.
And quite bizarre. Hoyt and Schatten (1993) had absolutely nothing to do with Baliunas and Jastrow (1990).
Baliunas and Jastrow (1990) was a pioneering early analysis of the use of “sun-like star” observations to try and constrain the expected solar variability of the Sun over time:
S. Baliunas and R. Jastrow (1990). "Evidence for long-term brightness changes of solar-type stars". Nature 348, 520–523 (1990). https://doi.org/10.1038/348520a0 (paywalled, but pdf available here)
It was a seminal paper in the early 1990s. However, Hoyt and Schatten (1993) never used their analysis or even cited the study. Their reconstruction did not involve any data or information from sun-like stars.
Dr. Sallie Baliunas is a co-author of C2021 (Paper 6), C2023 (Paper 9) and S2023 (Paper 10) and a long-time colleague of Dr. Soon.
Prof. Robert “Bob” Jastrow (1925-2008) was the founding director of NASA GISS (from 1961 to 1981) and Dr. Gavin Schmidt is the current director of NASA GISS (from 2014). Perhaps this is why Dr. Schmidt has an unusual obsession with that 1990 paper.
As regards Dr. Schmidt’s claim that Baliunas and Jastrow (1990) has “been found to not be valid”, this is a rather misleading misrepresentation of the scientific literature on what we know from sun-like stars.
Baliunas and Jastrow (1990) was the first attempt to use the preliminary data to estimate the amplitude of changes in stellar activity of quiet non-cycling periods (like the Sun appears to have gone through during the Maunder Minimum, 1645-1715) and cycling periods (like the Sun is at present).
Dr. Baliunas and Dr. Soon were directly involved in two of the more detailed analyses of this early data:
Q. Zhang, W.H. Soon, S.L. Baliunas, G.W. Lockwood, B.A. Skiff and R.R. Radick (1994). "A Method of Determining Possible Brightness Variations of the Sun in Past Centuries from Observations of Solar-Type Stars". Astrophysical Journal Letters, 427, L111. https://doi.org/10.1086/187377 (Open access).
S.L. Baliunas, R.A. Donahue, W.H. Soon, J.H. Horne, J. Frazer, L. Woodard-Eklund, M. Bradford, L.M. Rao, O.C. Wilson, Q. Zhang, W. Bennett, J. Briggs, S.M. Carroll, D.K. Duncan, D. Figueroa, H.H. Lanning, T. Misch, J. Mueller, R.W. Noyes, D. Poppe, A.C. Porter, C.R. Robinson, J. Russell, J.C. Shelton, T. Soyumer, A.H. Vaughan and J.H. Whitney (1995). "Chromospheric Variations in Main-Sequence Stars. II." Astrophysical Journal. 438, 269. https://doi.org/10.1086/175072. (Open access)
During the mid-2000s, several papers revisited the original estimates from the early data in light of an extra decade of data. Some of these estimates (including one involving, Gregory. W. Henry, a co-author of C2021, C2023 and S2023) initially suggested that those estimates were too high. This is what Dr. Schmidt was alluding to, e.g.,
J.C. Hall and G.W. Lockwood (2004). "The Chromospheric Activity and Variability of Cycling and Flat Activity Solar-Analog Stars". The Astrophysical Journal, 614 (2), 942. https://doi.org/10.1086/423926 (Open access)
J.T. Wright (2004). "Do We Know of Any Maunder Minimum Stars?". The Astronomical Journal, 128, 1273-1278. http://dx.doi.org/10.1086/423221 (Open access)
P.G. Judge and S.H. Saar (2007). "The Outer Solar Atmosphere during the Maunder Minimum: A Stellar Perspective". The Astrophysical Journal, 663 (1), 643. https://doi.org/10.1086/513004 (Open access).
J.C. Hall, G.W. Henry, G.W. Lockwood, B.A. Skiff and S.H. Saar (2009). "The activity and variability of the Sun and Sun-like Stars. II. Contemporaneous Photometry and Spectroscopy of Bright Solar Analogs." The Astronomical Journal, 138 (1), 312. https://doi.org/10.1088/0004-6256/138/1/312 (Open access)
However, more recent updates of the data (again involving our co-author, Greg Henry) have suggested that the original estimates might coincidentally have been close enough, e.g.,
R.R. Radick, G.W. Lockwood, G.W. Henry, J.C. Hall and A.A. Pevtsov (2018). "Patterns of Variation for the Sun and Sun-like Stars". The Astrophysical Journal, 855 (2), 75. https://doi.org/10.3847/1538-4357/aaaae3. (Open access)
P.G. Judge, R. Egeland and G.W. Henry (2020). "Sun-like Stars Shed Light on Solar Climate Forcing". The Astrophysical Journal, 891 (1), 96. https://doi.org/10.3847/1538-4357/ab72a9 (Open access).
Moreover, Prof. Wright, whose 2004 paper Dr. Schmidt cited as alleged proof that the non-cycling stars of Baliunas and Jastrow (1990) were in error, has since co-authored several papers in which he proposes a new candidate for a non-cycling star (including a paper co-authored with our colleague, Greg Henry):
A.C. Baum, J.T. Wright, J.K. Luhn and H. Isaacson (2022). "Five Decades of Chromospheric Activity in 59 Sun-like Stars and New Maunder Minimum Candidate HD 166620". The Astronomical Journal, 163 (4), 183. https://doi.org/10.3847/1538-3881/ac5683 (Open access)
J.K. Luhn, J.T. Wright, G.W. Henry, S.H. Saar and A.C. Baum (2022). "HD 166620: Portrait of a Star Entering a Grand Magnetic Minimum". The Astrophysical Journal Letters, 936 (2), L23. https://doi.org/10.3847/2041-8213/ac8b13 (Open access)
We think that the use of sun-like star data for trying to constrain our understanding of the range of solar activity we should expect for our Sun over time is important. We encourage more research into collecting and analysing more sun-like star data.
For more information on the ongoing debates over the sun-like star data and their implications for our understanding of historic TSI variability, see:
pp. 421-422 of S2015: Soon, Connolly & Connolly (2015). Earth-Science Reviews, 150, 409-452. https://doi.org/10.1016/j.earscirev.2015.08.010. (Preprint version)
pp. 20-22 of C2021: Connolly and 22 co-authors (2021). Research in Astronomy and Astrophysics, 21, 131. https://doi.org/10.1088/1674-4527/21/6/131. (Open access)
pg. 27 of S2023: Soon and 36 co-authors (2023). Climate, 11(9), 179; https://doi.org/10.3390/cli11090179. (Open access)
At any rate, Hoyt and Schatten (1993) had absolutely nothing to do with Baliunas and Jastrow (1990).
Claim 7: The scientific debates over the best satellite TSI composite are irrelevant for evaluating TSI changes since the 19th century (False)
Claim 7: The ongoing scientific debate over which of the various satellite TSI composites (e.g., ACRIM vs. PMOD) are most reliable “is irrelevant to the longer term variability” of the pre-satellite era TSI estimates (Schmidt, Sep 6 2023 blog)
This is not true.
The ongoing debates over which of the many satellite TSI composites available are correct has significant implications for establishing which solar proxies are necessary (and what weightings should be used) for best capturing the solar variability in the pre-satellite era.
As we explained in S2023 (Paper 10), pp. 12-13,
“In terms of satellite TSI composites, there are several available, but the most distinct composites are:
1. The Active Cavity Radiometer Irradiance Monitor (ACRIM) composite. This implies TSI increased between solar minima during the 1980s and 1990s but decreased during the early 21st century.
2. The Physikalisch-Meteorologisches Observatorium Davos (PMOD) composite. This implies TSI has slightly decreased between solar minima over the entire satellite era, i.e., 1979-present.
3. The Royal Meteorological Institute of Belgium (RMIB) composite. This implies TSI has remained remarkably constant between solar minima over the entire satellite era.
The choice of satellite composite used for calibration has considerable implications for the most suitable solar proxies to use for the pre-satellite era, i.e., before 1979. If the RMIB composite is correct, then it could be argued that TSI largely follows the sunspot cycles and simply calibrating a suitable sunspot number record should give a reasonable TSI reconstruction for the pre-satellite era, e.g., Dewitte et al. (2022). If the PMOD composite is correct, then a suitably rescaled sunspot number record should also give a reasonable TSI reconstruction, but the addition of extra solar proxies could potentially improve accuracy, e.g., Wang and Lean (2021). The Matthes et al. (2017) reconstruction used by CMIP6 for AR6 appears to have taken this second philosophy.
However, if the ACRIM composite is correct, then reconstructing TSI for the pre-satellite era becomes a much more challenging problem. That is because the variability in the TSI of solar minima implied by ACRIM is not captured by the sunspot number record (which reaches a minimum of exactly zero sunspots every solar minimum). ACRIM therefore implies that long-term (inter-cycle) trends in TSI need to be considered as well as the short-term (~11-year solar cycle) variability. Hoyt and Schatten (1993) was a very significant TSI reconstruction specifically because it used multiple solar proxies to attempt to capture both the short-term (~11-year solar cycle) and the long-term (inter-cycle) multidecadal variability—see also Hoyt (1979). Scafetta et al. (2019) updated this 1993 reconstruction to 2018 using the ACRIM team’s composite.”
We also discussed the significance of the debates over the satellite composites for developing pre-satellite era TSI reconstructions in several of our other papers:
pp. 414-424 of S2015: Soon, Connolly & Connolly (2015). Earth-Science Reviews, 150, 409-452. https://doi.org/10.1016/j.earscirev.2015.08.010. (Preprint version)
pp. 5-14, 58 of C2021: Connolly and 22 co-authors (2021). Research in Astronomy and Astrophysics, 21, 131. https://doi.org/10.1088/1674-4527/21/6/131. (Open access)
pp. 11-12, 15 of C2023: Connolly and 19 co-authors (2023). Research in Astronomy and Astrophysics. https://doi.org/10.1088/1674-4527/acf18e. (Still in press, but pre-print available here)
For what it’s worth, two of the NASA ACRIM team (Scafetta and Willson) are co-authors on C2021 (Paper 6). Both Scafetta and Douglas Hoyt (member of the team in charge of the NIMBUS7 TSI satellite mission) are co-authors on C2021 (Paper 6); C2023 (Paper 9) and S2023 (Paper 10).
Claim 8: The Hoyt and Schatten (1993) TSI reconstruction is the only one of the 27 that finds a large solar role (False)
Claim 8: The updated Hoyt and Schatten (1993) TSI reconstruction is the only one of the 27 TSI reconstructions that we have found across the 10 papers to find a large solar contribution to the long-term warming since 1850 (Schmidt, Sep 10 2023)
This is nonsense and Dr. Schmidt knows this full well.
In C2023 (Paper 9), we compare all five Northern Hemisphere temperature estimates to the “only natural factors”, “only anthropogenic factors” and “both natural and anthropogenic factors” using 27 different estimates of TSI. One of those 27 TSI estimates is the updated Hoyt and Schatten series (abbreviated to H1993 in the paper). And indeed, it was consistently a reasonable fit for all of the temperature series, but there were better fitting TSI records for each temperature series.
Below are the top 3 fits in terms of “only natural factors” for all five temperature series:

Claim 9: Soon (2005) made a “failed prediction” about Arctic temperatures (Misleading)
Claim 9: A 2005 study by Dr. Soon made a “failed prediction” about Arctic temperature trends for the 21st century (Schmidt, Sep 6 2023 blog and Sep 9 2023 Tweets)
As we explained already in our Sep 8th, 2023 reply to Dr. Schmidt’s misrepresentation of the Soon (2005; 2009) papers,
“In Soon (2005), Dr. Soon noticed a remarkable correlation between the Hoyt and Schatten (1993) TSI series and Arctic temperatures from 1875 to 2000.
In a follow-up paper, Soon (2009) repeated his analysis using (a) a newer version of the Hoyt and Schatten TSI series that had been updated to 2007 and (b) NASA GISS’ Arctic temperature record from 1880-2007.
The comparison is shown below adapted from Figure A.1 of Soon (2009):
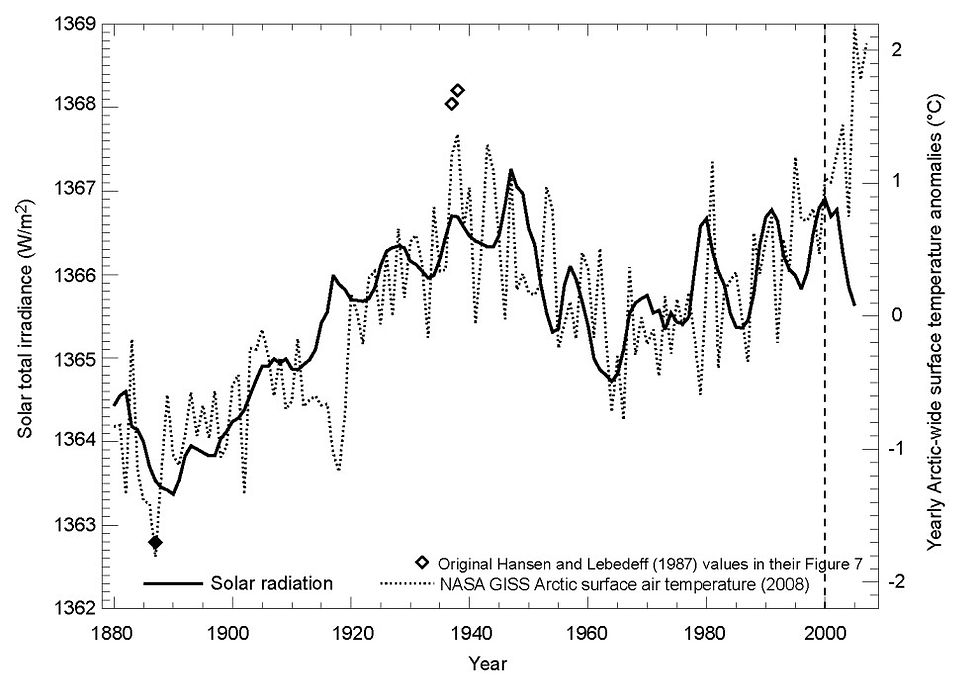
In this week’s blog post, Dr. Schmidt conceded that the fit looked ok in 2005, but he claims it no longer holds:
“But time marches on, and what might have looked ok in 2005 (using data that only went to 2000) wasn’t looking so great in 2015.”
Dr. Schmidt then showed a plot he did in 2015 using a different TSI record from that used by Soon. His reanalysis failed to identify a compelling correlation when applied to the updated NASA GISS Arctic temperature record.
On the other hand, also in 2015, as part of our analysis of Northern Hemisphere rural temperature trends, in Soon et al. (2015) we included our own update to the original Soon (2005; 2009) analysis.
Below is Figure 27(d) of Soon et al. (2015). The blue line represents Arctic temperatures, while the dashed red line represents TSI:

We appreciate that Dr. Schmidt has now conceded that his attempt to “re-do” Soon (2005; 2009) analysis using a different TSI was disingenuous.
He now claims that:
Using the GISTEMP Arctic temperature series from 1880-2020 the fit is not as good as our 2015 fit using our Arctic records from 1830 to 2014
Dr. Soon (2005) was a “prediction” of what would happen in the future.
Neither Soon (2005); Soon (2009); nor S2015 (Paper 1) made any predictions about future Arctic temperatures.
As we discussed in S2015 (Paper 1), C2017 (Paper 2) and C2021 (Paper 6), we still have concerns about the reliability and consistency of the Arctic temperature data when comparing recent trends to those of the 19th century. But, so far we think the overall match between the updated Hoyt and Schatten TSI reconstruction and Arctic temperatures since the early-19th century suggests a possibly large solar influence.
Claim 10: Dr. Soon is in the pay of Big Oil and all his work is corrupted by fossil fuel money (False and ad hominem)
Claim 10: “Willie Soon gets money from fossil fuel companies” (Schmidt, Sep 10 2023) and his scientific research is corrupted by funding from vested interests (Rahmstorf, Sep 4 2023).
Dr. Schmidt and Prof. Rahmstorf are repeating debunked disinformation. As the saying goes, a lie will travel halfway round the world before the truth has had a chance to tie its shoelaces.
Prof. Rahmstorf provided a screenshot from 2015 that uncritically repeated a false hit piece fabricated by a former Greenpeace activist, Roland “Kert” Davies, who had been trying to smear Dr. Soon’s reputation with libellous misinformation for decades, as part of his efforts to raise funding for Greenpeace USA.
For a detailed response from Dr. Soon to the erroneous “hit pieces” claiming he is in the pay of the fossil fuel industry, please see this presentation he gave in April 2022.
For more information on Roland Davies’ dishonest and deliberately misleading track record, you might find it useful to read Section 2 of our 2018 report entitled, “Analysis of Greenpeace’s business model & philosophy”.
Claim 11: Dr. Soon’s science is based on faulty assumptions and bad science (False and ad hominem)
Claim 11: Dr. Soon’s “science is based on faulty assumptions” (Schmidt, Sep 10 2023) and he has “lost any last shred of credibility he might once have had” (Mann, Sep 6 2023).
Obviously every scientist is entitled to their opinions of the scientific credibility and reliability of other scientists. We have our own opinions of the scientific credibility and reliability of Dr. Schmidt and Prof. Mann.
However, we have shown above that Dr. Schmidt’s “assumptions” of what our papers are about are littered with false and misleading characterizations.
We note that in just these papers alone, Dr. Soon, was a co-author with 53 other researchers from multiple institutions around the world. And according to Google Scholar, he has had 7829 citations to his work (2656 since 2018). Apparently, a lot of scientists feel that his work is credible, relevant and worth citing.
Claim 12: The 37 co-authors of S2023’s scientific reputations are very poor (False and ad hominem)
Claim 12: All 37 co-authors of S2023 have highly “questionable” reputations (Rahmstorf, Sep 3 2023)
Again, all scientists are entitled to their opinions of the calibre of other scientists, but we don’t think that such name-calling is suitable for scientific discourse.
We encourage readers who are curious about the reputations of the highly accomplished 37 co-authors on S2023 to research them.
As some examples, we remind the readers that Dr. Baliunas was a colleague of Prof. Bob Jastrow who founded the NASA Goddard Institute for Space Studies (GISS) that Dr. Schmidt currently is the director of. We note that all of the satellite TSI composites use the NASA ACRIM satellite TSI data and NASA and NOAA’s NIMBUS-7 satellite TSI data. Dr. Willson (co-author of C2021) was the principal investigator of the NASA ACRIM satellite missions and Prof. Scafetta (co-author of C2021, C2023 and S2023) was a member of the ACRIM team. Douglas Hoyt (co-author of C2021, C2023 and S2023) was one of the main team members in charge of the NIMBUS-7 satellite mission. Also, many of the 27 TSI reconstructions available today use Hoyt and Schatten (1998)’s group sunspot number (GSN) dataset as a key solar proxy. Gregory Henry (who led one of two teams that discovered the first transiting extrasolar planet, HD 209458 b) is one of the leading researchers in the observation of sun-like stars. Prof. Syun-Ichi Akasofu’s major contributions to scientific research in the Arctic have been recognised by the fact that the building of the International Arctic Research Center at the University of Alaska Fairbanks is named after him.
Claim 13: Dr. Soon assumes that the Sun must be the dominant climate driver and is blinded by confirmation bias (False)
Claim 13: Dr. Soon assumes “that the sun *must* be the dominant impact on the climate and so it’s just required to find the proof. That leads to multiple cases of confirmation bias and spurious correlation. This turns normal science on its head.” (Schmidt, Sep 10 2023)
This is a bizarre claim. The purpose of our detection and attribution studies was to identify how much of the observed climate change was due to anthropogenic factors and how much was due to natural factors.
Here are the relevant concluding statements in the abstracts of our 3 most recent detection and attribution of climate change studies:
“For all five Northern Hemisphere temperature series, different TSI estimates suggest everything from no role for the Sun in recent decades (implying that recent global warming is mostly human-caused) to most of the recent global warming being due to changes in solar activity (that is, that recent global warming is mostly natural).” – C2021 (Paper 6)
“…it is still unclear whether the observed warming is mostly human-caused, mostly natural or some combination of both.” – C2023 (Paper 9)
“… the scientific community is not yet in a position to confidently establish whether the warming since 1850 is mostly human-caused, mostly natural, or some combination.” – S2023 (Paper 10)
It sounds to us like Dr. Schmidt is the one who has already decided what the primary climate driver is before the scientific challenges of this very complex problem have been satisfactorily resolved.
Conclusions
What is RealClimate.org’s goal in this orchestrated disinformation campaign?
Apparently, it is to stop people from reading our papers.
Why?
Maybe the answer lies in the papers themselves:
“S2015”: W. Soon, R. Connolly and M. Connolly (2015). “Re-evaluating the role of solar variability on Northern Hemisphere temperature trends since the 19th century”. Earth-Science Reviews, 150, 409-452. https://doi.org/10.1016/j.earscirev.2015.08.010. (Preprint version)
“C2017”: R. Connolly, M. Connolly and W. Soon (2017). “Re-calibration of Arctic sea ice extent datasets using Arctic surface air temperature records”. Hydrological Sciences Journal, 62, 1317-1340. https://doi.org/10.1080/02626667.2017.1324974. (Open access)
“S2018”: W.W-H. Soon, R. Connolly, M. Connolly, P. O’Neill, J. Zheng, Q. Ge, Z. Hao and H. Yan (2018). Comparing the current and early 20th century warm periods in China. Earth-Science Reviews, 185, 80-101. https://doi.org/10.1016/j.earscirev.2018.05.013. (Preprint version)
“S2019”: W.W-H. Soon, R. Connolly, M. Connolly, P. O’Neill, J. Zheng, Q. Ge, Z. Hao and H. Yan (2019). “Reply to Li & Yang’s comments on “Comparing the current and early 20th century warm periods in China."” Earth-Science Reviews. 189, 102950. https://doi.org/10.1016/j.earscirev.2019.102950. (Preprint version)
“C2020”: R. Connolly, M. Connolly, R.M. Carter and W. Soon (2020). “How much human-caused global warming should we expect with business-as-usual (BAU) climate policies? A semi-empirical assessment”. Energies, 13, 1365. https://doi.org/10.3390/en13061365 (Open access).
“C2021”: R. Connolly, W. Soon, M. Connolly, S. Baliunas, J. Berglund, C. J. Butler, R. G. Cionco, A. G. Elias, V. M. Fedorov, H. Harde, G. W. Henry, D. V. Hoyt, O. Humlum, D. R. Legates, S. Lüning, N. Scafetta, J.-E. Solheim, L. Szarka, H. van Loon, V. M. Velasco Herrera, R. C. Willson, H. Yan and W. Zhang (2021). “How much has the Sun influenced Northern Hemisphere temperature trends? An ongoing debate”. Research in Astronomy and Astrophysics, 21, 131. https://doi.org/10.1088/1674-4527/21/6/131. (Open access)
“O’N2022”: P. O'Neill, R. Connolly, M. Connolly, W. Soon, B. Chimani, M. Crok, R. de Vos, H. Harde, P. Kajaba, P. Nojarov, R. Przybylak, D. Rasol, Oleg Skrynyk, Olesya Skrynyk, P. Štěpánek, A. Wypych and P. Zahradníček (2022). “Evaluation of the homogenization adjustments applied to European temperature records in the Global Historical Climatology Network dataset”. Atmosphere, 13(2), 285. https://doi.org/10.3390/atmos13020285. (Open access)
“K2023”: G. Katata, R. Connolly and P. O’Neill (2023). "Evidence of urban blending in homogenized temperature records in Japan and in the United States: implications for the reliability of global land surface air temperature data". Journal of Applied Meteorology and Climatology. 62(8), 1095-1114. https://doi.org/10.1175/JAMC-D-22-0122.1. (Open access)
“C2023”: R. Connolly, W. Soon, M. Connolly, S. Baliunas, J. Berglund, C.J. Butler, R.G. Cionco, A.G. Elias, V. Fedorov, H. Harde, G.W. Henry, D.V. Hoyt, O. Humlum, D.R. Legates, N. Scafetta, J.-E. Solheim, L. Szarka, V.M. Velasco Herrera, H. Yan and W.J. Zhang (2023). "Challenges in the detection and attribution of Northern Hemisphere surface temperature trends since 1850". Research in Astronomy and Astrophysics. https://doi.org/10.1088/1674-4527/acf18e. (Still in press, but pre-print available here)
“S2023”: W. Soon, R. Connolly, M. Connolly, S.-I. Akasofu, S. Baliunas, J. Berglund, A. Bianchini, W.M. Briggs, C.J. Butler, R.G. Cionco, M. Crok, A.G. Elias, V.M. Fedorov, F. Gervais, H. Harde, G.W. Henry, D.V. Hoyt, O. Humlum, D.R. Legates, A.R. Lupo, S. Maruyama, P. Moore, M. Ogurtsov, C. ÓhAiseadha, M.J. Oliveira, S.-S. Park, S. Qiu, G. Quinn, N. Scafetta, J.-E. Solheim, J. Steele, L. Szarka, H.L. Tanaka, M.K. Taylor, F. Vahrenholt, V.M. Velasco Herrera and W. Zhang (2023). "The Detection and Attribution of Northern Hemisphere Land Surface Warming (1850–2018) in Terms of Human and Natural Factors: Challenges of Inadequate Data", Climate, 11(9), 179; https://doi.org/10.3390/cli11090179. (Open access)


Кадрова криза на будівництві часто проявляється у зриві строків, різній якості робіт і залежності від окремих майстрів. Готові заводські системи можуть зменшити частину людського фактору, якщо монтаж стає простішим і більш передбачуваним. Але важливо правильно організувати логістику, інструктаж і контроль. Про такий підхід можна прочитати тут: Кадрова криза на будівництві: як мінімізувати ризики людського фактору за допомогою готової заводської системи.
Mình có lần lướt đọc mấy trao đổi trên mạng شيخ روحاني thì thấy nhắc nên cũng tò mò mở ra xem thử cho biết. Mình không tìm hiểu sâu جلب الحبيب chỉ xem qua trong thời gian ngắn để quan sát bố cục جلب الحبيب cách sắp xếp شيخ روحاني các mục và trình bày nội شيخ روحاني dung tổng thể. Cảm giác là các phần được trình bày khá gọn, các Berlinintim mục rõ ràng nên đọc lướt cũng không bị rối Berlinintim, với mình như شيخ روحاني vậy là đủ để nắm tin cơ bản rồi. جلب الحبيب
To be fair, this post was kinda solid.
When I opened it, I thought it would be basic content, however ended up going through it.
There’s something about the tone that feels more natural, even though it’s not perfect.
Btw, I ran into https://zhinochiporady.com not long ago and saw something close in style, like it’s not just SEO content.
A few points hit the point, and that’s not common.
Also, it wasn’t trying too hard.
In any case, good stuff — saving this for later.
Maybe see what else you have.
I mean, this article ended up being surprisingly useful.
Initially, I felt like it was going to be nothing special, yet I kept reading.
Could be the way it’s written that feels more natural, even if it’s not too long.
Btw, I checked https://zhinochiporady.com earlier today and felt kinda the same tone, like someone actually writes for people.
Certain things here actually made sense, and that’s rare.
Not sure if it matters but, it wasn’t annoying to read.
idk but yeah, kinda enjoyed it — probably will check more.
Probably check other posts.
Навіть якщо ремонт невеликий, до нього варто підходити уважно: перевірити поверхні, продумати порядок робіт і врахувати можливі нюанси. Корисні матеріали про будинок і побут можуть заощадити час на пошук базової інформації. У цьому контексті органічно виглядає https://wse.com.ua/vseznai/budnok-i-remont/.